PropData
Data Engineering & Analytics Platform for Multifamily Real Estate
Problem
Multifamily property managers operate across fragmented Property Management Systems (PMS) like Resman, Yardi Voyager, and Appfolio. Each system stores lease data, occupancy rates, and financial metrics in completely different schemas, making it nearly impossible to aggregate portfolio-wide analytics or generate competitive rental comp reports.
Meanwhile, market rent data is scattered across listing sites like Apartments.com and paid APIs like RentCast, with no unified way to compare a property's performance against the broader market. Clients needed a single source of truth that could ingest data from all of these sources, normalize it, and deliver actionable insights.
Technical Architecture
I designed and built the entire data engineering backend: ETL pipelines, web scrapers, data warehouse schema, and analytics dashboards.
- ETL Pipelines: Custom connectors for Resman API v2, Yardi Voyager API, and Appfolio REST API, extracting lease data, unit-level occupancy, and financial records
- Web Scrapers: Python-based scrapers for Apartments.com (Selenium + BeautifulSoup) and RentCast API integration for rental comp data across 86+ markets
- Data Warehouse: PostgreSQL with normalized schema mapping disparate PMS formats into a unified property/unit/lease data model
- Analytics Engine: Rental comp analysis comparing property performance against market averages by unit type, submarket, and time period
- Languages: Python (Jupyter Notebooks, scrapers, ETL scripts), SQL (data transformations, reporting queries)
- Scheduling: Automated pipeline runs with monitoring, error handling, and partial-run recovery
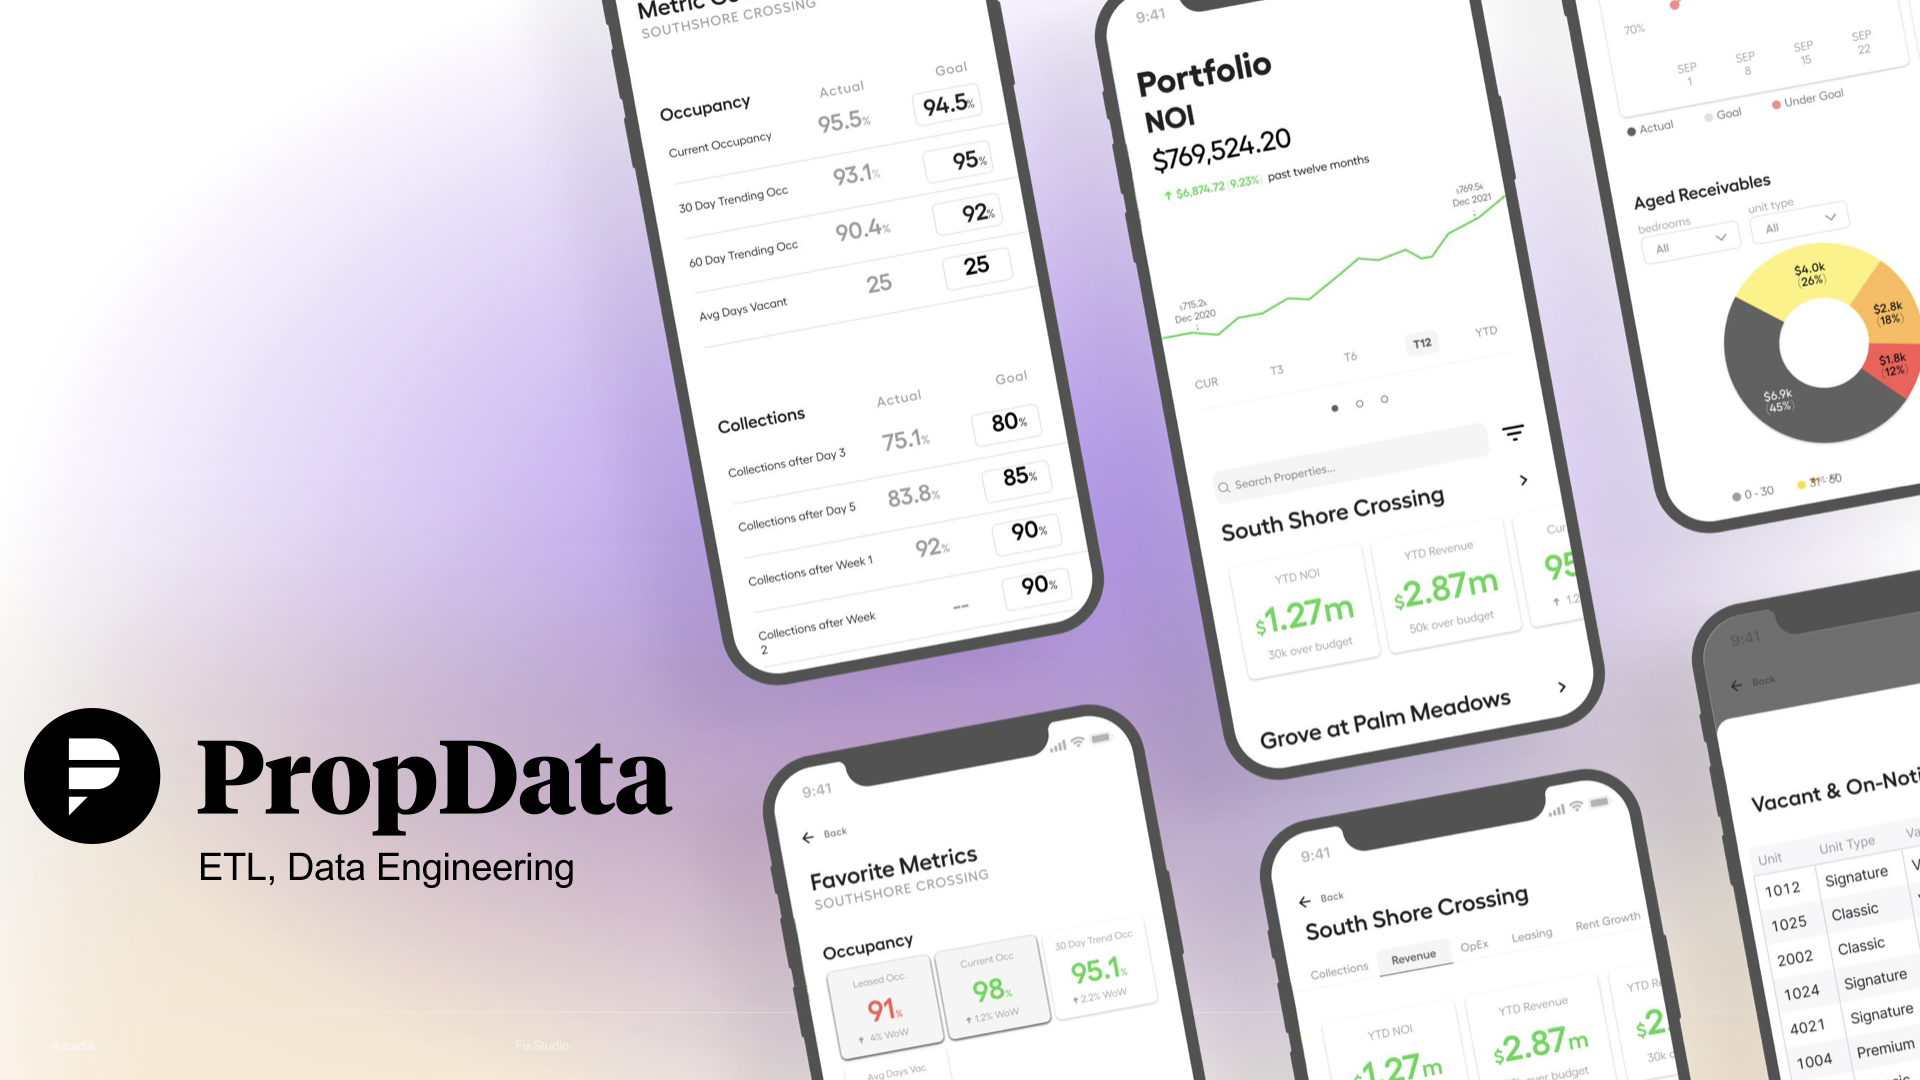
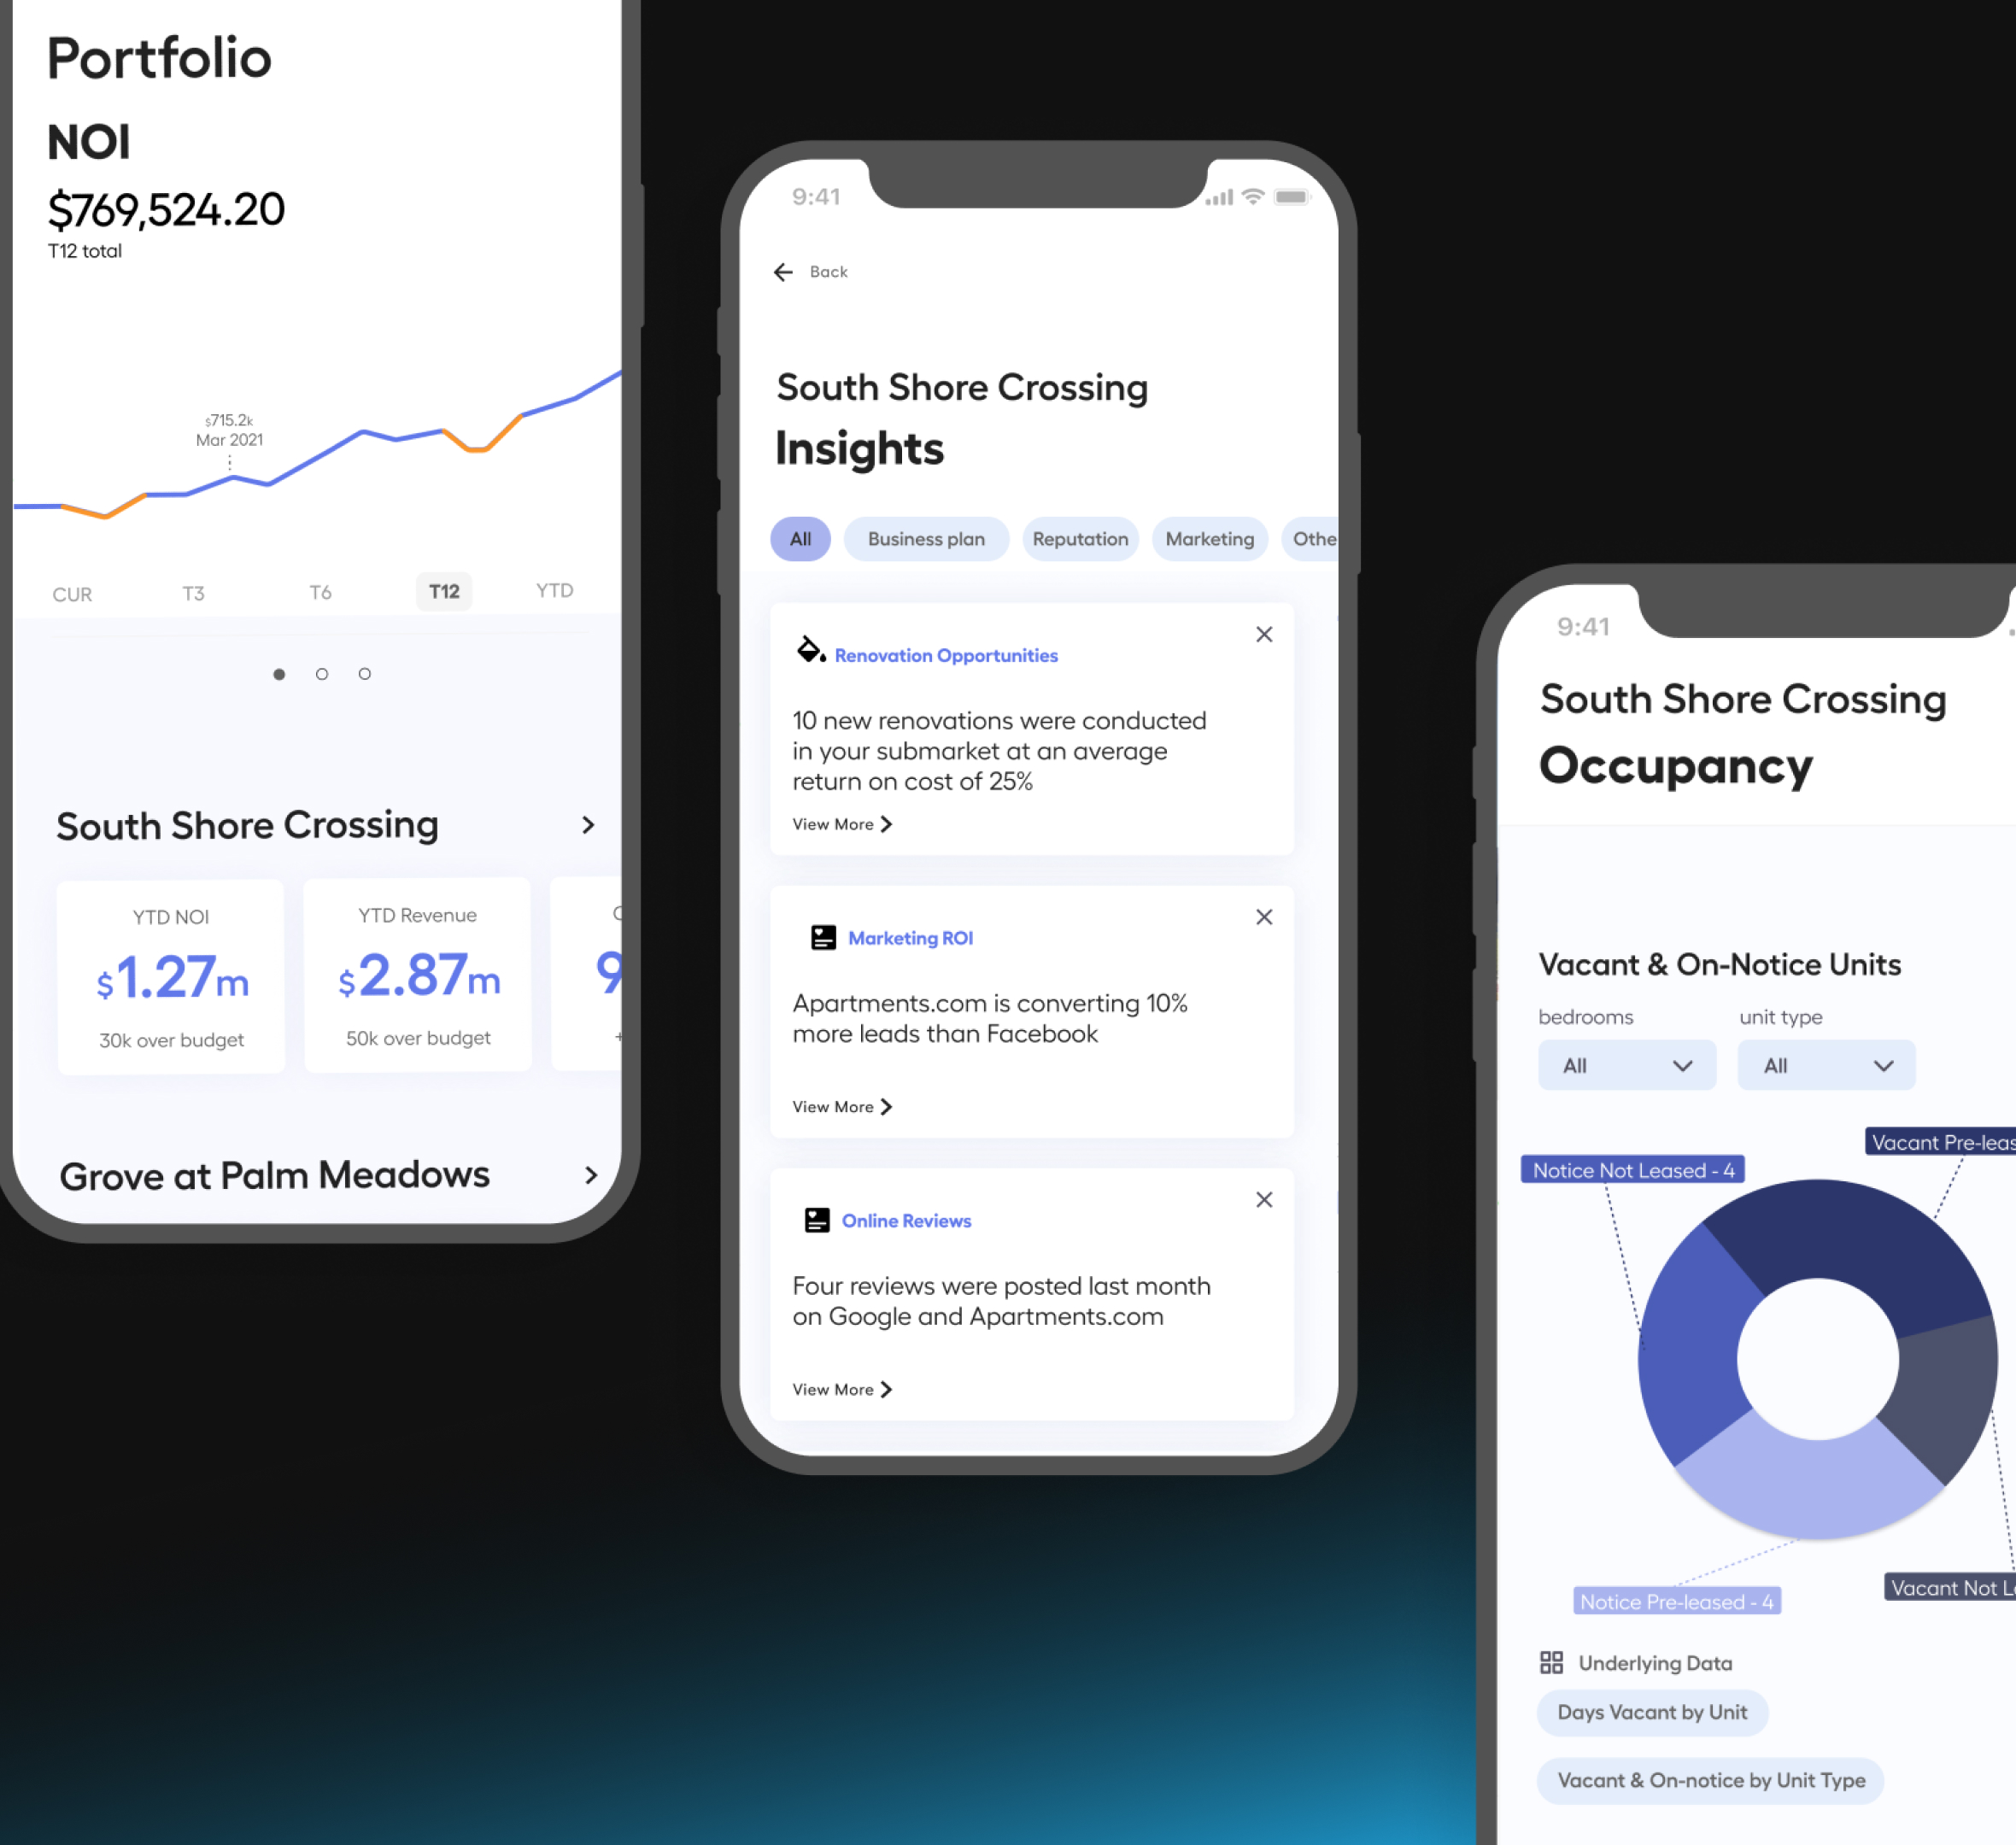
Platform Views
The platform provides real-time visibility into pipeline health, data source status, and rental market analytics.
Technical Challenges
- Schema normalization: Each PMS (Resman, Yardi, Appfolio) uses fundamentally different data models for the same concepts (leases, units, tenants), requiring careful mapping and transformation logic
- Scraper reliability: Apartments.com frequently changes its DOM structure and implements anti-bot measures, requiring adaptive scraping strategies and fallback selectors
- Data freshness vs. cost: Balancing API rate limits and RentCast quota costs against the need for up-to-date comp data across 86+ markets
- Partial pipeline recovery: Building idempotent ETL runs that could resume from failure points without duplicating records or corrupting aggregates
Impact
- Unified data from 3 PMS platforms into a single warehouse, giving clients portfolio-wide visibility for the first time
- Automated rental comp collection across 86+ markets, replacing hours of manual research per property
- Enabled data-driven rent pricing decisions with market trend analysis and occupancy benchmarking
- Processed 847K+ records daily across all pipelines with automated monitoring and alerting
My Contribution
I was the sole data engineer on this project, responsible for the entire data pipeline architecture from source integration to client-facing analytics.
- Built all ETL pipelines from scratch for Resman, Yardi Voyager, and Appfolio, handling API authentication, pagination, rate limiting, and incremental sync
- Developed web scrapers for Apartments.com using Selenium and BeautifulSoup, and integrated RentCast API for rental comp data with Jupyter Notebook-based analysis workflows
- Designed the data warehouse schema in PostgreSQL, normalizing disparate PMS formats into a unified property/unit/lease model with SQL transformation layers
- Built the analytics engine for rental comp analysis, comparing property performance against market averages by unit type, submarket, and time period
- Created client-facing dashboards and automated reporting pipelines delivering weekly market insights